Award-Winning Fast, Flexible C# .NET Chart Control
Build dynamic dashboards and data visualizations with FlexChart, a cross-platform C# .NET chart control.
- Choose from 80+ popular chart types and configurations
- Add built-in features for interaction, analysis, annotations and animation
- Handle large data sets with optimized rendering solutions for each platform
Overview
.NET chart controls are UI libraries for creating and displaying 2D charts in .NET applications. ComponentOne FlexChart provides bar, line, area, and many other chart types to help developers visualize data in meaningful ways.
Why Choose FlexChart?
Cross-Platform Compatibility
Shorten your cross-platform learning curve with C# charts for WinForms, WPF, UWP, Blazor, ASP.NET MVC, Xamarin, and Wijmo JavaScript.
80+ Chart Types and Variations
Build the exact chart you need with FlexChart's many built-in chart types, combination plots and stacking options.
Create Interactive Dashboards
Bring your data visualizations to life with interactive features like scrolling, zooming, selection and drill-down.
Built-In Analysis Features
Write less C# or VB.NET code with built-in data analysis features such as waterfall series, error bars and trendlines.
Flexible Customization
FlexChart exposes C# and VB.NET event handlers and properties that allow custom styles for data points and labels.
Fast, Pixel-Perfect Rendering
With DirectX and GDI+ rendering on desktop and SVG on the web, your charts will look and perform great.
C# .NET Chart Types
Bar and Column Charts


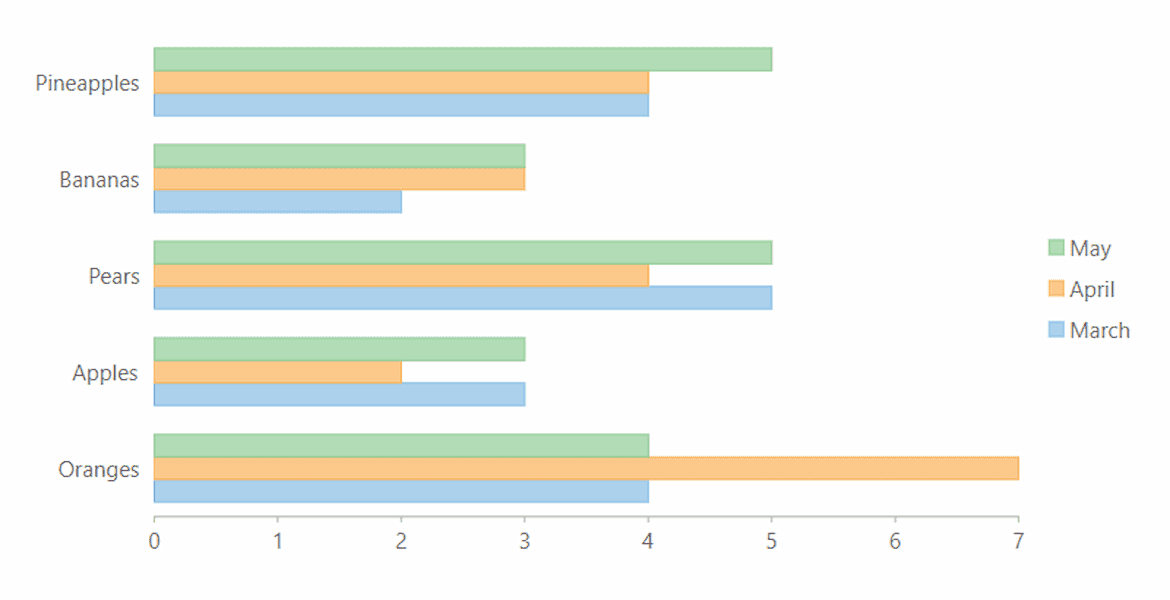

Floating Bar Chart
A floating bar or range column chart shows two values, a minimum and maximum, for each column or bar. The plot can be rotated to create a Gantt-style chart as well.
Learn More: WinForms | WPF | UWP | ASP.NET MVC | Blazor

Line and Area Charts


Step Charts
Step line charts help visualize changes at a specific point. Data points are connected through vertical and horizontal lines. Display symbols or fill the area.
Learn More: WinForms | WPF | UWP | ASP.NET MVC | Xamarin


Range Area Charts
Fill in the area below the line to demonstrate trends in similar categories. Shows variations in the data values for a given time.
Learn More: WinForms | WPF | UWP | ASP.NET MVC
Scatter Charts


C# Financial Charts


More Financial Charts
With Studio Enterprise you get FinancialChart, which includes 9 additional chart types including Heikin-Ashi, Kagi, Renko and more.
Pie and Sunburst Charts


Multiple Pie Charts
Use FlexPie to visualize more data in a single chart by creating multiple pie chart "series" using the same data source. An effective way of presenting data, especially if the intent is to show one section relative to the whole.
Learn More: WinForms | WPF | UWP | ASP.NET MVC
Radar and Polar Charts

Radar Charts
Display multivariate observations with an arbitrary number of variables. FlexRadar supports line, area, column, scatter and stacked chart types.
Learn More: WinForms | WPF | UWP | ASP.NET MVC | Blazor

Radar Column Charts
Create a windrose chart using FlexRadar and the Column chart type. This visualization lets you display changes in the radar through radiating columns with stacking support.
Learn More: WinForms | WPF | UWP | ASP.NET MVC | Blazor

Polar Charts
Create circular graphs to display multivariate observations with an arbitrary number of variables. FlexRadar can generate polar charts with lines, columns, filled areas and custom symbols.
Learn More: WinForms | WPF | UWP | ASP.NET MVC | Blazor
Specialized C# Chart Types

Error Bar Charts
Error bars help you see margins of error and standard deviations at a glance. They can be shown as a standard error amount, a percentage, or a standard deviation.
Learn More: WinForms | WPF | UWP | ASP.NET MVC | Blazor

Box-and-Whisker Charts
Graphically depict groups of numerical data through their quartile, mean, median and outliers.
Learn More: WinForms | WPF | UWP | ASP.NET MVC | Blazor
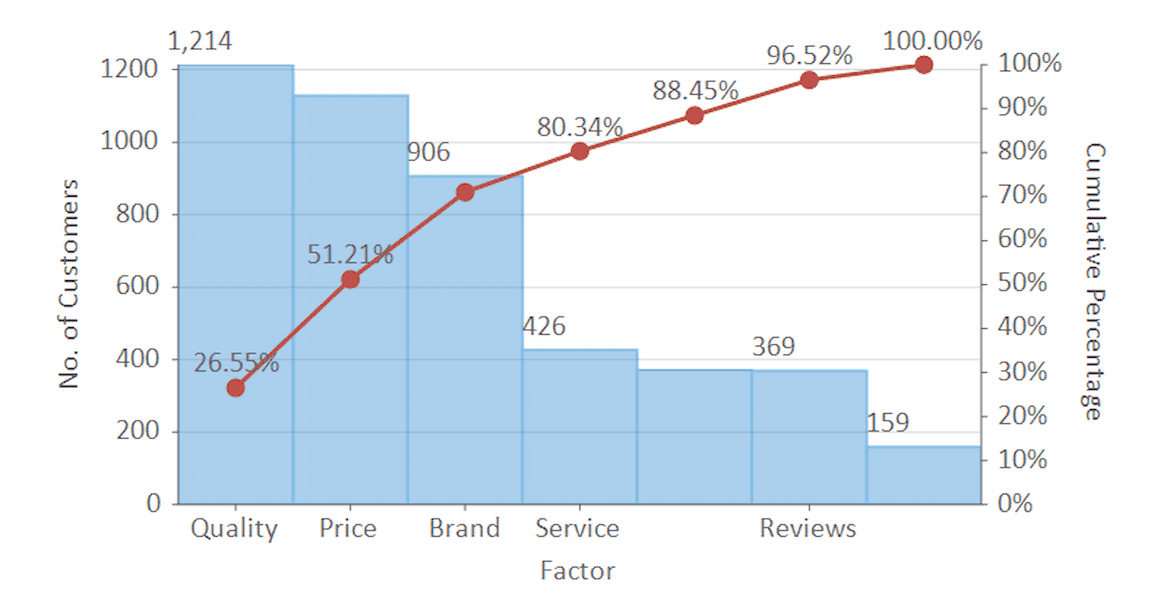

Waterfall Charts
A waterfall chart helps understand the cumulative effect of sequentially introduced positive or negative values. Optionally, display auto-calculated intermediate totals in the waterfall chart.
Learn More: WinForms | WPF | UWP | ASP.NET MVC

BreakEven Charts
A break-even chart shows the sales volume level at which total costs equal sales. The chart plots revenue, fixed costs, and variable costs on the vertical axis, and volume on the horizontal axis.
Learn More: WinForms | WPF | ASP.NET MVC | Blazor

Gantt Charts
Manage a project with a Gantt chart and never miss a step. Includes dependencies and percent complete, start and end dates for each task, and information such as completion states and task dependencies.
Learn More: WinForms | WPF | ASP.NET MVC | Blazor

Funnel Charts
Visualize stages of a process, such as a sales funnel, using a funnel shape. Supports triangular or rectangular shape.
Learn More: WinForms | WPF | UWP | ASP.NET MVC | Blazor

TreeMap Charts
Display hierarchical information combined with relative quantity. Highlight hierarchical, tree-structured data as a set of nested rectangles and help to analyze the anomalies in the data set.
Learn More: WinForms | WPF | UWP | ASP.NET MVC | Blazor

C# .NET Chart Features
High Performance Rendering

For the fastest performance, FlexChart supports DirectX on desktop and WebGL rendering in the browser. Or, you may use the default GDI+ or SVG rendering for full feature support.
Learn More: WinForms | WPF | UWP | ASP.NET MVC
Interactive Features

Zooming and Panning
Interact with the chart using mouse or tap gestures. Use pinch gesture, mouse wheel or double click to zoom in/out.
Learn More: WinForms | WPF | UWP | ASP.NET MVC | Xamarin


C# Chart Style Features

Color Palettes
Quickly choose one of FlexChart's 20 built-in color palettes including sequential, diverging and qualifying palettes which are helpful in visualizing ordered or diverging data sets. Or customize your own palette with full opacity and gradient support.
Learn More: WinForms | WPF | UWP | ASP.NET MVC | Xamarin | Blazor

Animation
Add animation when the .NET chart is loaded or when data points are updated. Choose an easing function and how to animate the data points.
Learn More: WinForms | WPF | UWP | ASP.NET MVC | Blazor

Custom Axes and Gridlines
C# Chart Axis Features


C# Chart Legend Features


Custom Legends
Further customize the legend with scrolling or custom icons.
Learn More: WinForms | WPF | UWP | ASP.NET MVC | Xamarin
Additional Features
Data Labels and Tooltips

Annotations
Annotations improve clarity of the chart using arbitrary text, images and shapes that can be attached to data points or plot coordinates. You can even allow end-users to edit annotations in FlexChart.
Learn More: WinForms | WPF | UWP | ASP.NET MVC

Combination Charts
Easily combine any Cartesian chart types into a single plot using FlexChart's flexible model. Each series can be set to a different chart type, allowing endless composite chart combinations.
Learn More: WinForms | WPF | UWP | ASP.NET MVC | Blazor

Multiple Plot Areas
Define multiple plot areas to display plots stacked horizontally and vertically. Stacking plot areas helps visualize multiple series in a single chart.
Learn More: WinForms | WPF | UWP | ASP.NET MVC | Blazor

Trendlines
Add trend lines to show trends in data and make predictions. FlexChart supports several built-in regression and non-regression trendlines such as linear, average and polynomial.
Learn More: WinForms | WPF | UWP | ASP.NET MVC | Blazor

Range Selector
With the range selector, you can enable scrolling between two charts where one is a preview of all data and one is filtered (or zoomed) to the selected range for closer analysis.
Learn More: WinForms | WPF | UWP | ASP.NET MVC | Blazor
.NET Chart Supported Platforms

WinForms Charts
The WinForms C# and VB.NET charts are designed with the end-user in mind. Put the power of customization in your users hands with runtime chart designers, editable annotations and a runtime chart toolbar.

WPF Charts
The WPF charts have performance in mind with high performance DirectX rendering, and native XAML data binding for true MVVM applications.

UWP Charts
Get interactive charts for Windows 10 apps to build the perfect dashboard. With drill-down and zooming gestures, you can build a complete data visualization experience for mobile and desktop users alike.

ASP.NET MVC Charts
Our ASP.NET MVC and ASP.NET Core Charts balance performance and style with top notch WebGL rendering and CSS-based styling. FlexChart can be also be hosted as part of HTTP services (ASP.NET Web API or RESTful) for displaying chart images and exporting.

Blazor Charts
The Blazor FlexChart shares the same C# API as our WPF and UWP chart but it runs completely in the browser! Get interactive SVG rendering of all popular chart types.

Xamarin Charts
The Xamarin charts are designed with mobility and bold style in mind. With automatic legend positioning, smooth animation and full touch support FlexChart is the perfect all-in-one charting library for Xamarin apps.
C# .NET Chart Demos

Desktop Demo Explorer
All of our WinForms and WPF demos are included in a single downloadable desktop explorer. Explore every feature and showcase demos for FlexChart.

FlexChart ASP.NET MVC Demos
Explore every FlexChart feature and showcase demos right in your browser. Configure key properties and see what our .NET chart can do for your ASP.NET MVC applications.

Blazor Server Explorer
Explore every FlexChart key feature for Blazor including data binding, annotations, animation and more. A WebAssembly demo is also available.
Featured Blogs, Videos, and Other Resources


ComponentOne Customer Feedback and Awards

"Prompt responses, quality feedback, and help with code examples. Fantastic service!"
RICHARD HERBERT
"Excellent product with good support"
MIKE WEBSTER
"I am very appreciative of the effort your entire team gave to make this transaction happen. Thank you for your efforts!"
SAM COLE
 |
 |
Trusted by the World's Leading Companies